Broadband Mapping
View the Broadband Availability Atlas Demo

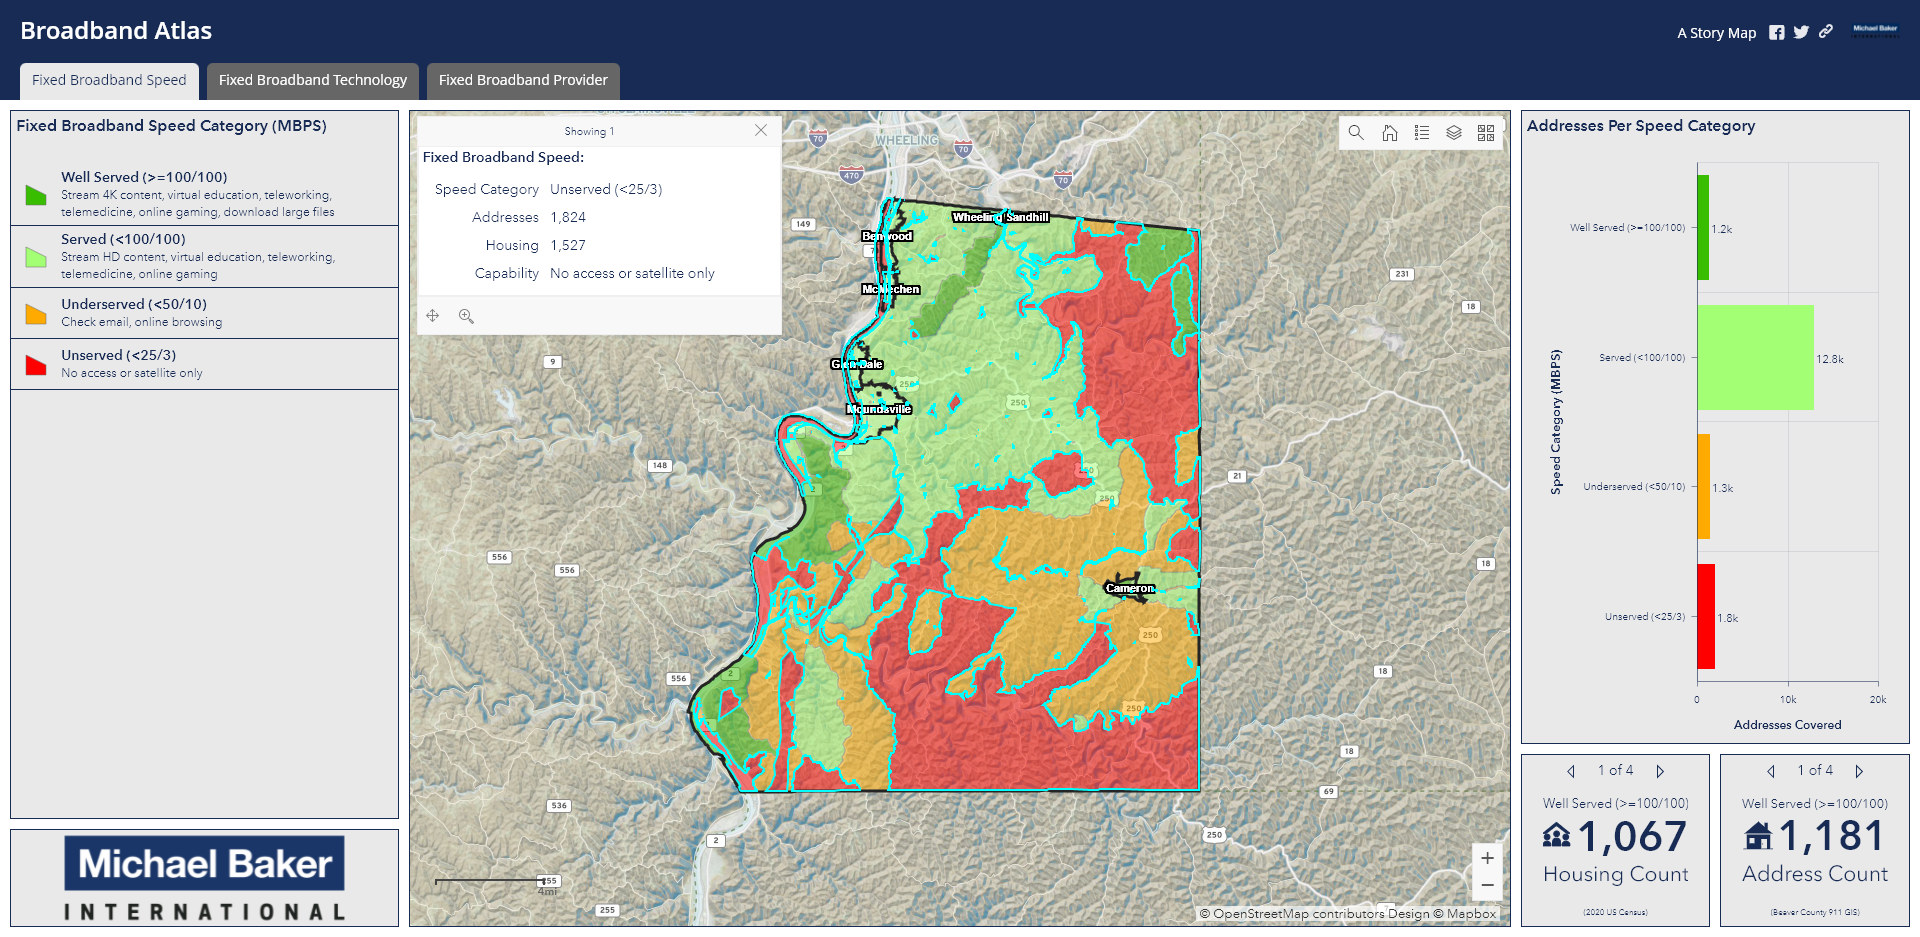
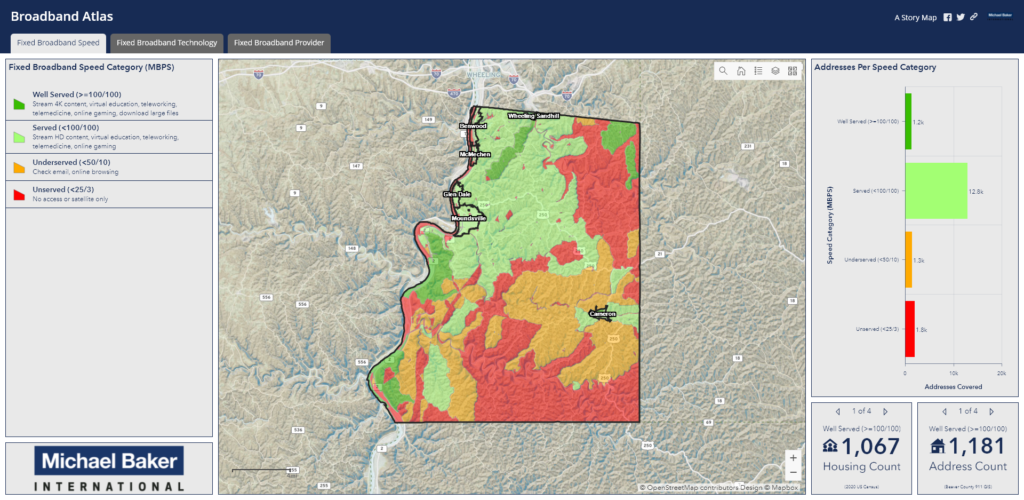
Availability is key to determining the current broadband status of the area being studied. This mapping application dashboard shows existing broadband availability of the current state of the study area. Mapping the availability will show current conditions related to broadband speed (those areas that are well-served to areas that are unserved) along with the number of current broadband providers in an area (Comcast, Verizon, Windstream), and what technologies (cable, DSL, fiber) are currently available in an area. This dashboard will also serve as an existing data hub where additional data layers, such as cellular towers, can be added to view the true state of connectivity as more broadband data is made readily available. This serves as your entryway into understanding the existing conditions of your area and allows Michael Baker to guide you to your next step – data collection and refinement.
Fixed Broadband Speed
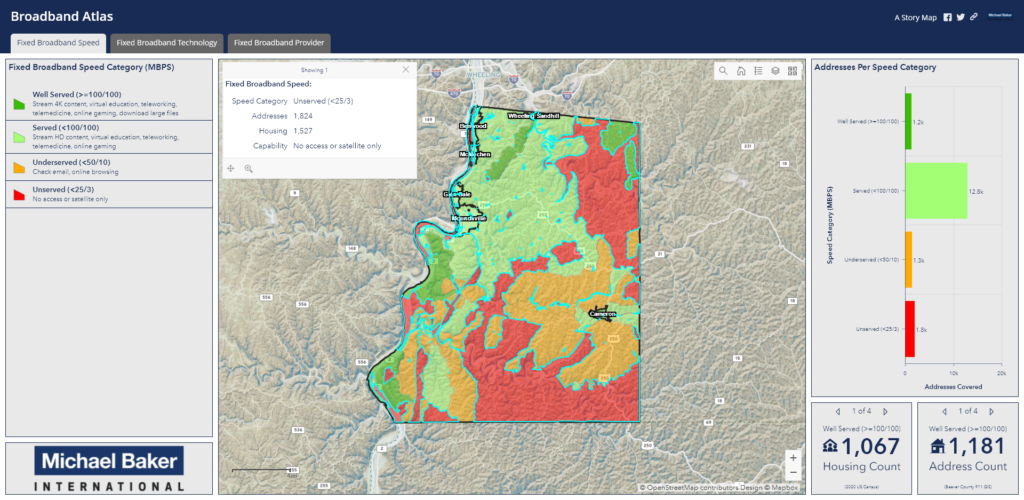
Fixed Broadband Speed
with unserved areas highlighted
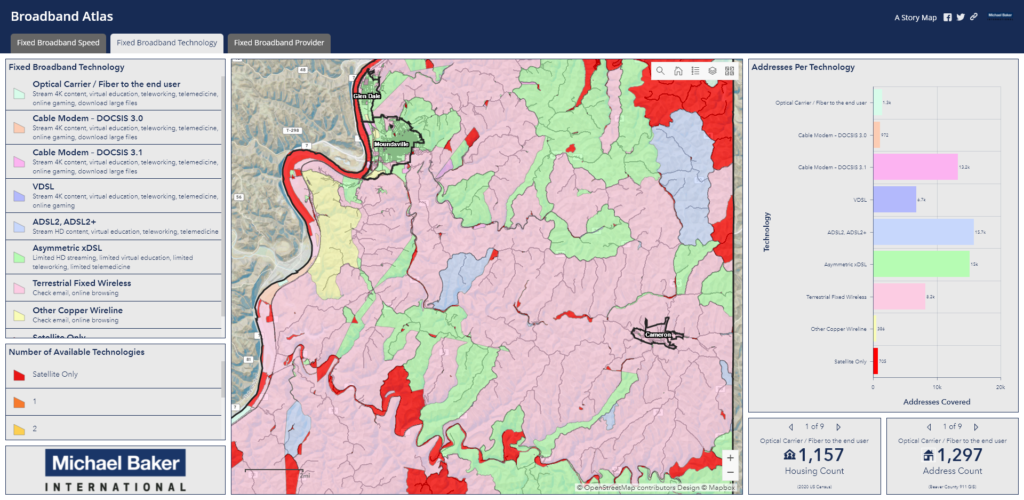
Fixed Broadband Technology
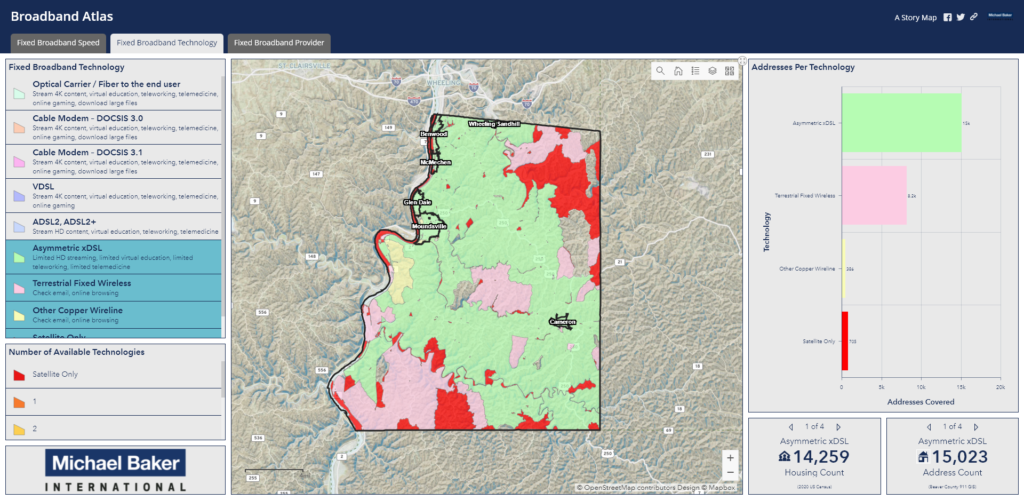
Fixed Broadband Technology
with four fixed broadband technologies highlighted
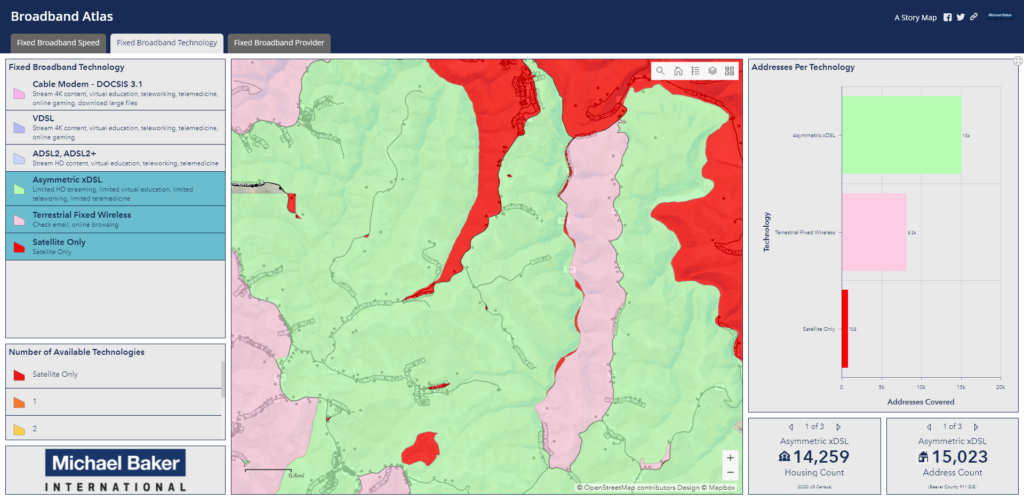
Fixed Broadband Technology
showing addresses in their covered area
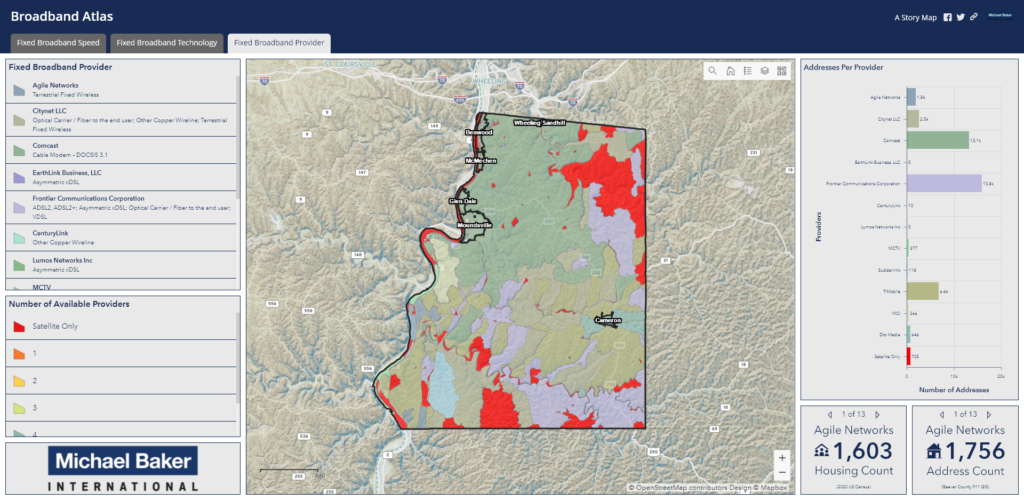
Fixed Broadband Provider
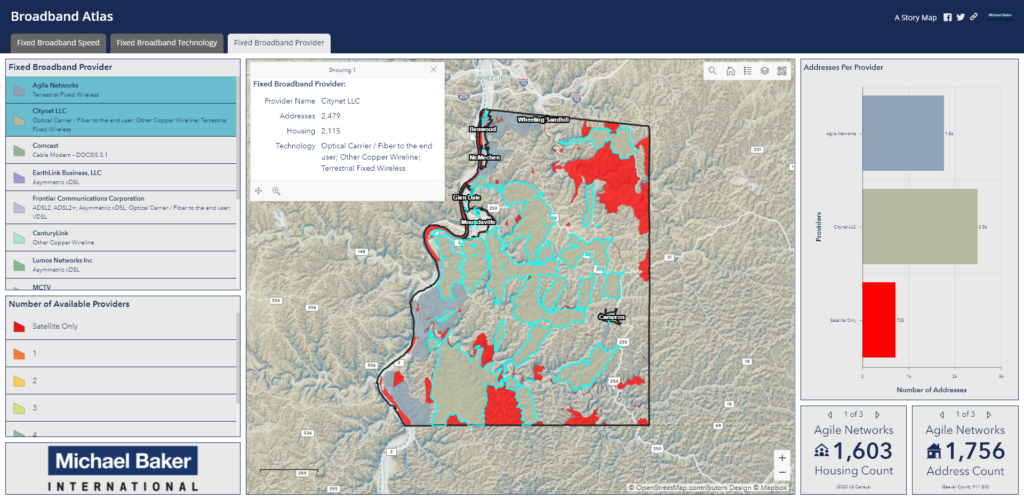
Fixed Broadband Provider
showing three fixed broadband providers and the areas they cover

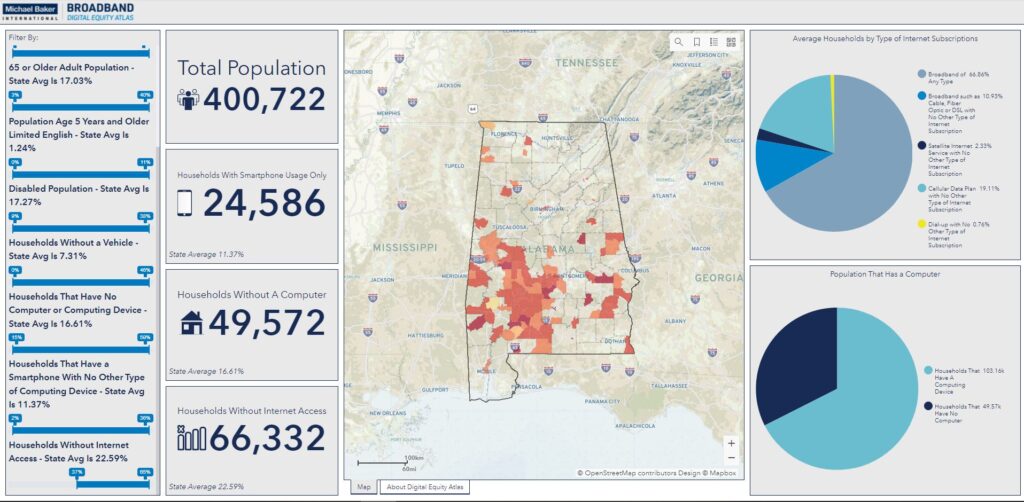
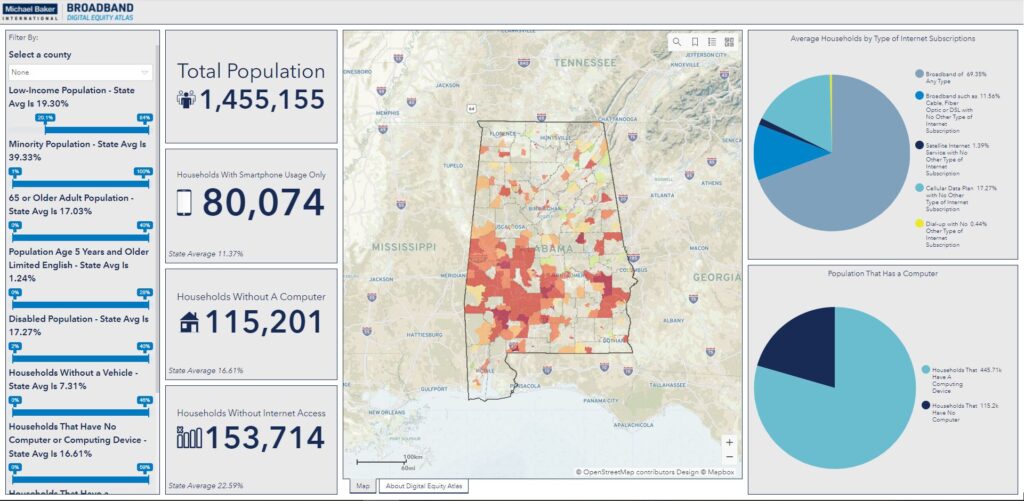
The Broadband Adoption and Equity Index Dashboard analyzes demographic and socioeconomic impacts based on adoption and affordability of broadband. The data used to create an Adoption and Equity Index may include, but not limited to broadband pricing, Environmental Justice (low income and minority) and Title VI (disabled, older adults) datasets. Additional data may include age, race, and population variables which lack adoption and affordability are also used in the data analysis. Gaps in adoption and affordability are then identified after all the data is mapped and analyzed. An index score is then created that identifies areas that have the greatest need for broadband adoption and affordability.
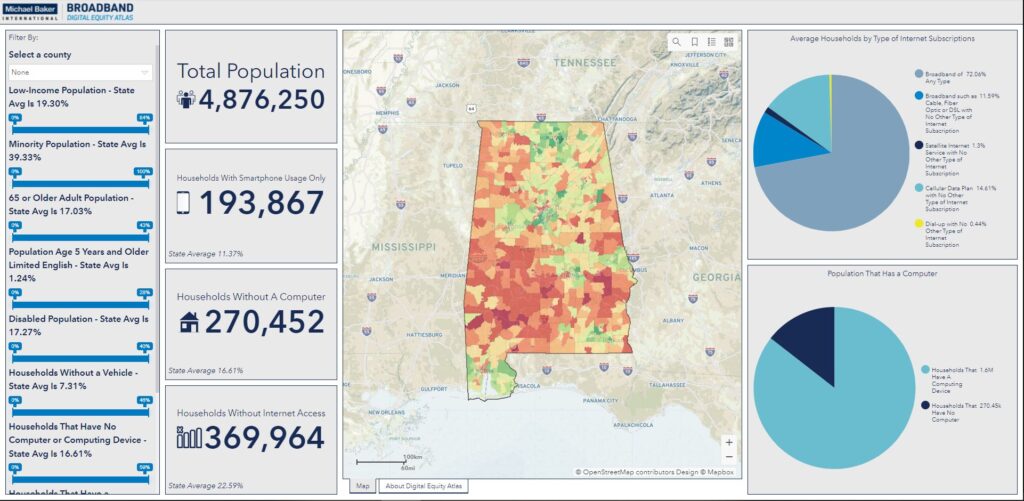
Alabama Broadband Digital Equity Index
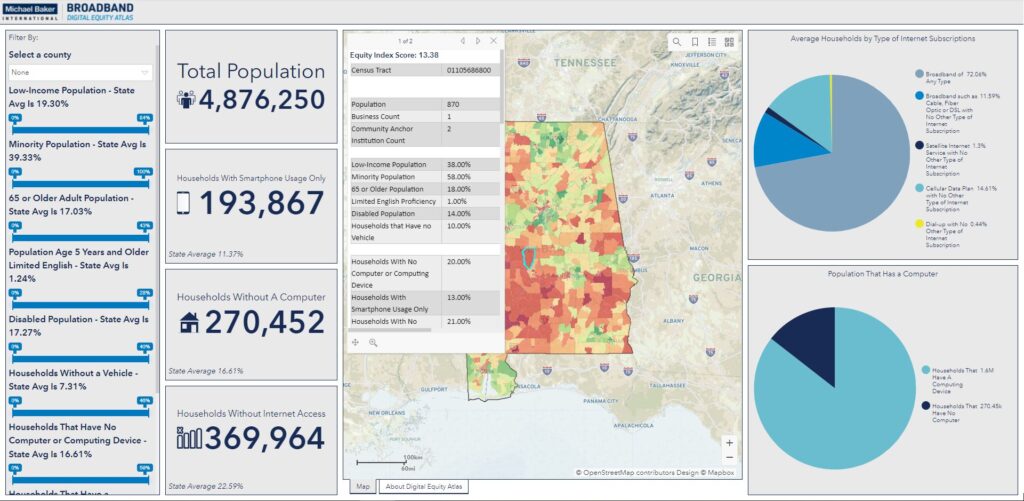
Alabama Broadband Digital Equity Index
with unserved areas highlighted
Alabama Broadband Digital Equity Index
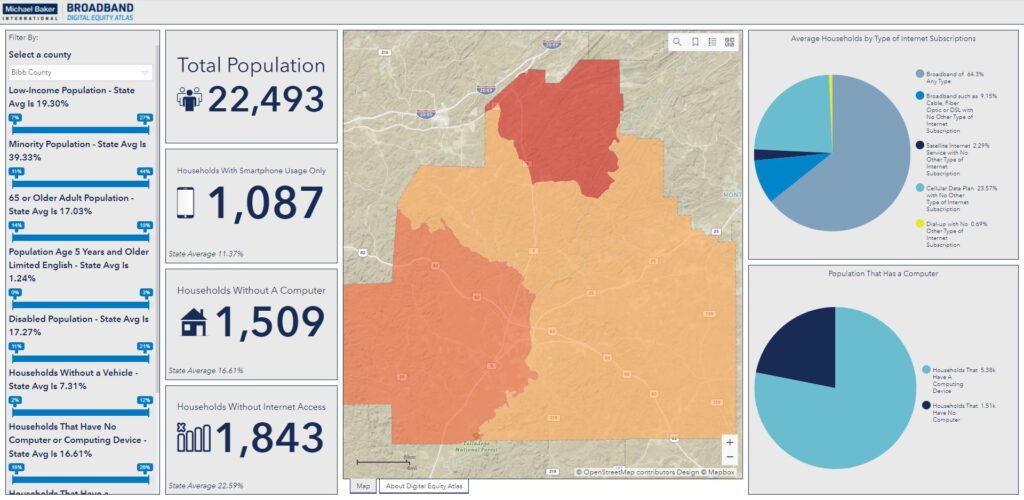
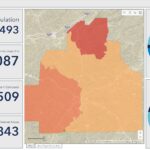
Alabama Broadband Digital Equity Index
